Posts

Showing posts with the label Prometheus

Angular on Azure App Service & Spring Boot Microservices on AKS with CI/CD, Helm, Azure DevOps, Prometheus, Grafana & Log Analytics: End-to-End Deployment

Image
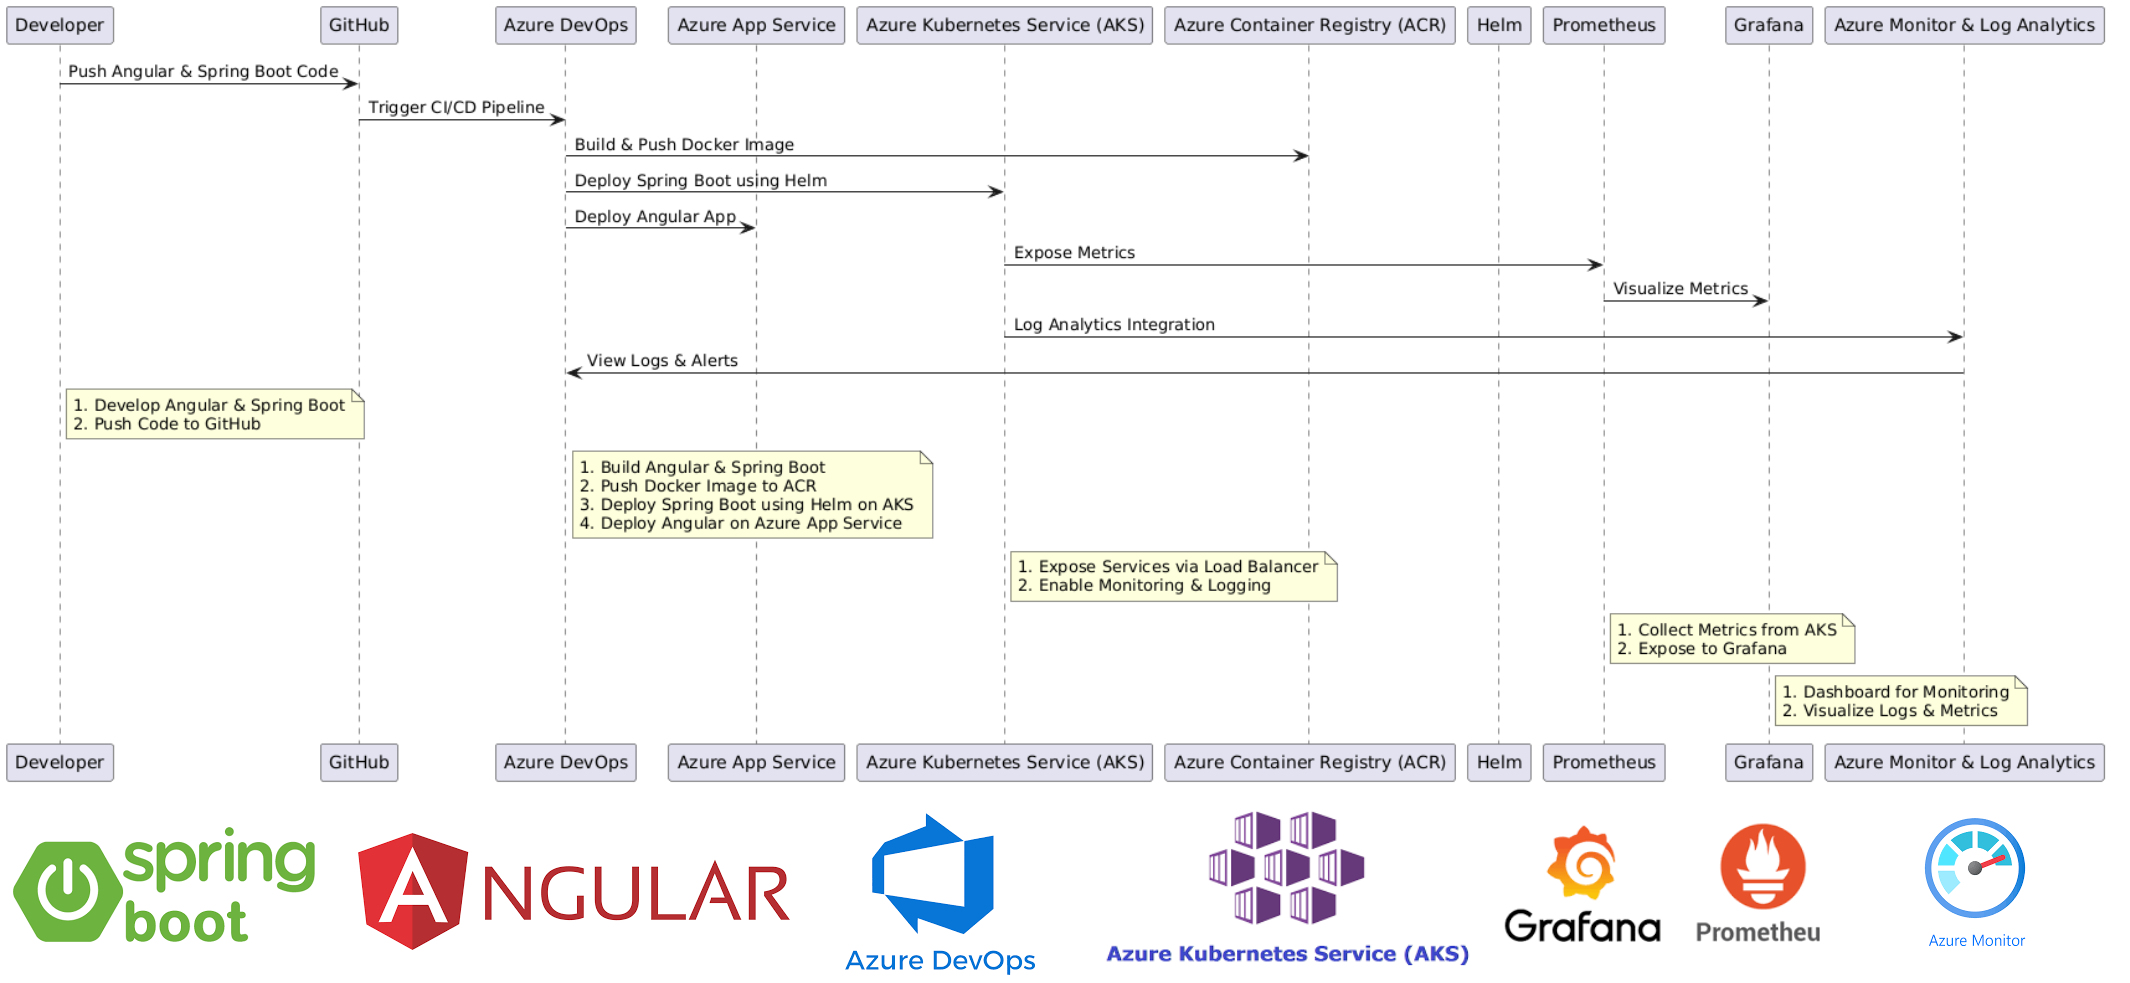
This diagram represents the end-to-end deployment workflow of an Angular frontend and Spring Boot microservices on Azure using Azure DevOps, Kubernetes, Helm, Prometheus, and Grafana . Key Flow: Code Development & Push: Developer writes Angular & Spring Boot code and pushes it to GitHub . CI/CD with Azure DevOps: GitHub triggers a CI/CD pipeline in Azure DevOps, which builds the project and pushes the Docker image to Azure Container Registry (ACR) . Deployment: Spring Boot microservices are deployed on Azure Kubernetes Service (AKS) using Helm . The Angular frontend is deployed on Azure App Service . Monitoring & Logging: Prometheus collects metrics from AKS and sends them to Grafana for visualization. Azure Monitor & Log Analytics track logs and alerts. This ensures automated deployments, monitoring, and logging for a production-ready cloud environment. End-to-End Deployment Guide Overview This guide covers the complete deployment of: Angular on Azure App S...

Setting Up Observability in Spring Boot Apps on Azure Kubernetes Service (AKS) with Logging, Tracing, and Metrics (Loki, Jaeger, Prometheus, Grafana, Azure Monitor): Complete Guide

Image
This Cloud Component Diagram represents the observability architecture for a Spring Boot Microservice running on Azure Kubernetes Service (AKS) with logging, tracing, and metrics monitoring . Key Components 1️⃣ Spring Boot Microservice (App) on AKS Sends logs to Loki (Logging) Sends traces to Jaeger via OpenTelemetry Exposes metrics to Prometheus Sends data to Azure Monitor 2️⃣ Observability Stack Loki collects logs → Grafana visualizes them Jaeger receives traces → Allows trace viewing Prometheus scrapes metrics → Grafana visualizes them 3️⃣ User Interaction Grafana provides real-time monitoring Azure Monitor collects logs & metrics for deeper analysis This architecture ensures full observability in a cloud-native microservices environment. Here is a complete guide to implement Observability in Spring Boot Apps on Azure Kubernetes Service (AKS) from scratch. This setup will cover logging, tracing, and metrics using tools like Loki , Jaeger , Prometheus , Grafana ...